Build Your Own Working Hardware in 10 Steps: An ESP32-C3 Temperature and Humidity Monitor
Ten steps from a documented dev board to a device you can trust: testable spec, four physical blocks, level-checked wiring, hysteresis-stabilised warning, failure-case tests, then enclosure and docs.
Your first useful gadget could start with a small board, a sensor and one LED. The satisfying moment comes when your code does something you can see: a measurement changes, the controller makes a decision and the device responds. You do not need to design a chip to get there; a documented development board and a few modules are enough for a first prototype.
What follows is one simple build carried through ten steps, from a clear purpose to tested behaviour: a USB-powered temperature and humidity monitor on an ESP32-C3, reading an SHT31-D sensor every two seconds and answering with a visible LED. The steps are straightforward. The debugging time will depend on your parts and your experience.
Why this is a good time to build
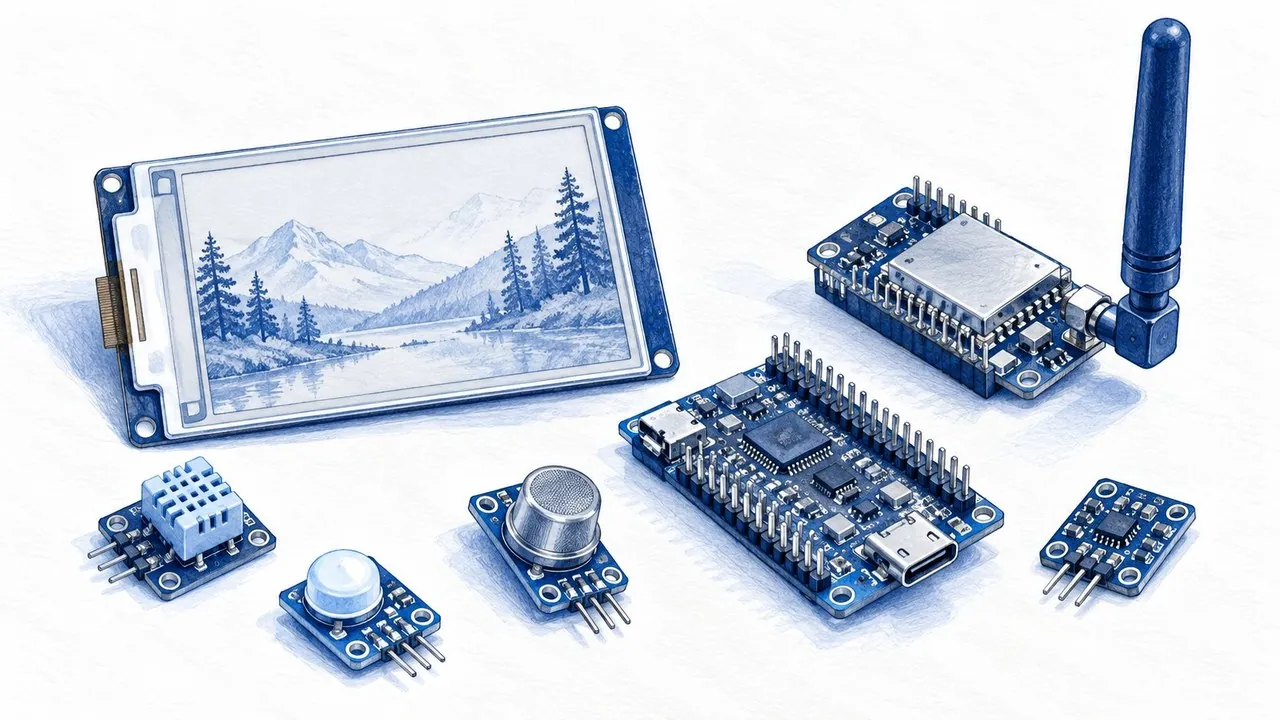
Small, useful hardware keeps appearing in the maker corner of X: e-paper readers, modular radio nodes, sensor devices and boards connected to AI services.
The ecosystem around that corner is concrete. On October 2, Nat Friedman announced Muse Gadgets, with open-source ESP32 firmware and a Linux SDK. M5Stack has been showing its PaperMono e-paper terminal. Meshtastic has highlighted modular nodes built with Axiometa. These are accessible hardware ecosystems you can read, flash and extend, not closed products you can only buy. (This is a qualitative snapshot of publicly searchable posts, mainly from August to October 2026, not a platform-wide popularity ranking.)
The useful lesson for your own build is straightforward: pick a function people can see, understand and test. A device can read a sensor, show a reminder or respond to a button without needing a complicated feature list. AI adds one more design choice on top: your hardware can send a request to an external service, or a supported platform can run a suitable model locally, the approach Espressif documents in ESP-DL. Choose the architecture that fits your task.
- Start with a task you actually care about.
- Use documented parts and examples.
- Make the result easy to verify.
Step 1. Give the device one clear job
The build in this guide is a USB-powered temperature and humidity monitor around an ESP32-C3-DevKitM-1 and an Adafruit SHT31-D sensor breakout. It reads the sensor every two seconds, prints the measurements to your computer, and switches on an external LED when a chosen threshold is reached. If readings fail, the LED blinks. That is the whole product.
Write that behaviour down before buying parts, including what happens when power returns and when a sensor is missing. A useful specification describes something you can test: "it updates every two seconds" gives you a clear check, while "it works well" leaves too much open.
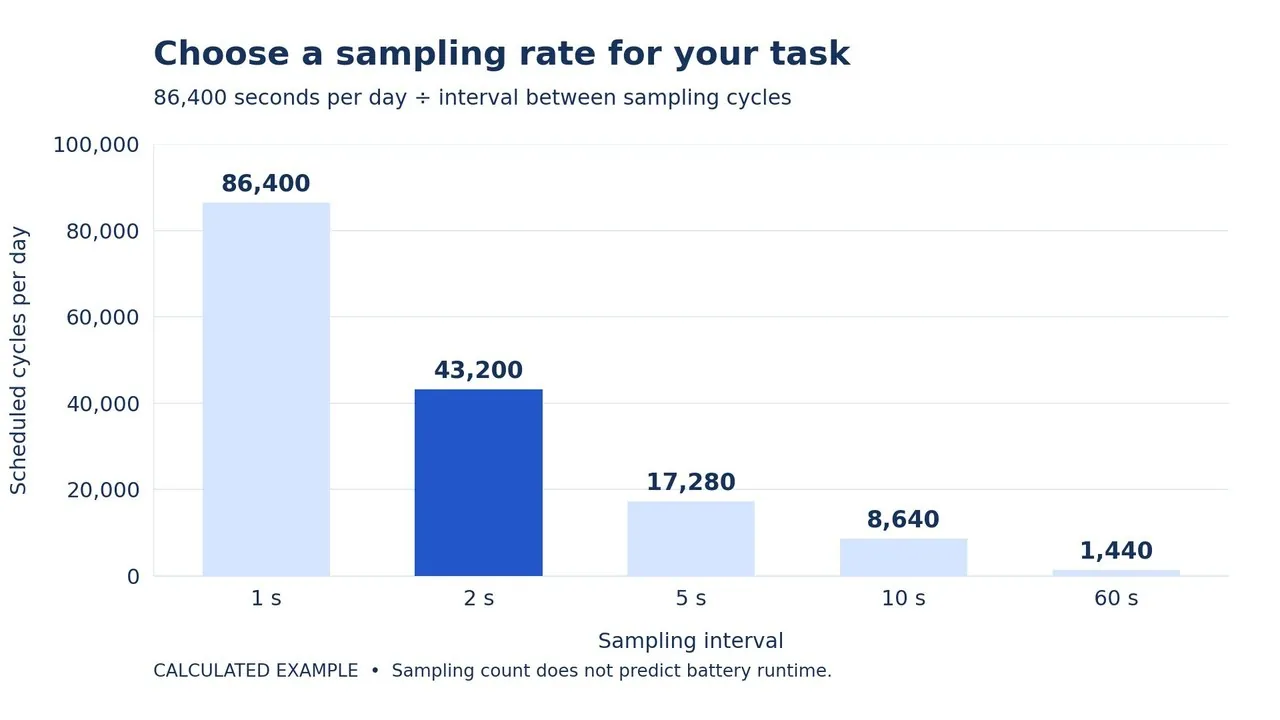
The reading interval belongs in that specification, and the arithmetic is worth seeing. A two-second interval schedules 43,200 sampling cycles per day; a ten-second interval schedules 8,640. That is a calculation (86,400 seconds divided by the interval), not an estimate of battery life, and it is the difference between a device you can reason about and one you cannot.
- What does the device measure or control?
- How quickly should it respond?
- What should happen if an input fails?
Step 2. Break the idea into physical blocks
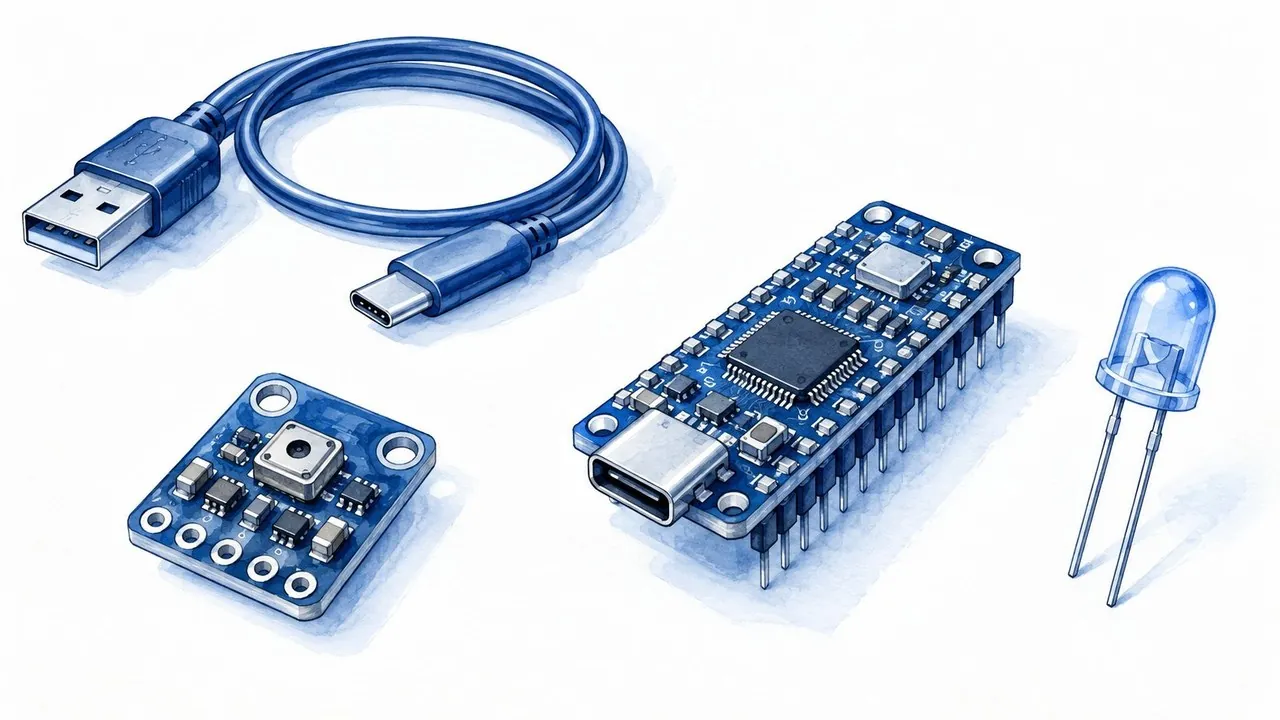
Your monitor has four roles: power, input, processing and output.
USB powers the board. The SHT31 provides measurements over I2C. The ESP32-C3 compares them with your thresholds. The LED and the serial output show what happened. Thinking in blocks is what makes debugging tractable: if measurements arrive but the LED stays dark, focus on the output circuit and the decision logic; if the sensor never responds, start with its power, wiring and address. Keep each block simple enough to test on its own, and add a screen or a wireless link only once the local measurement-and-response loop works.
- Power supplies the circuit.
- Input brings in a measurement or command.
- Processing decides what to do.
- Output makes the decision visible.
Step 3. Choose parts you can document and replace
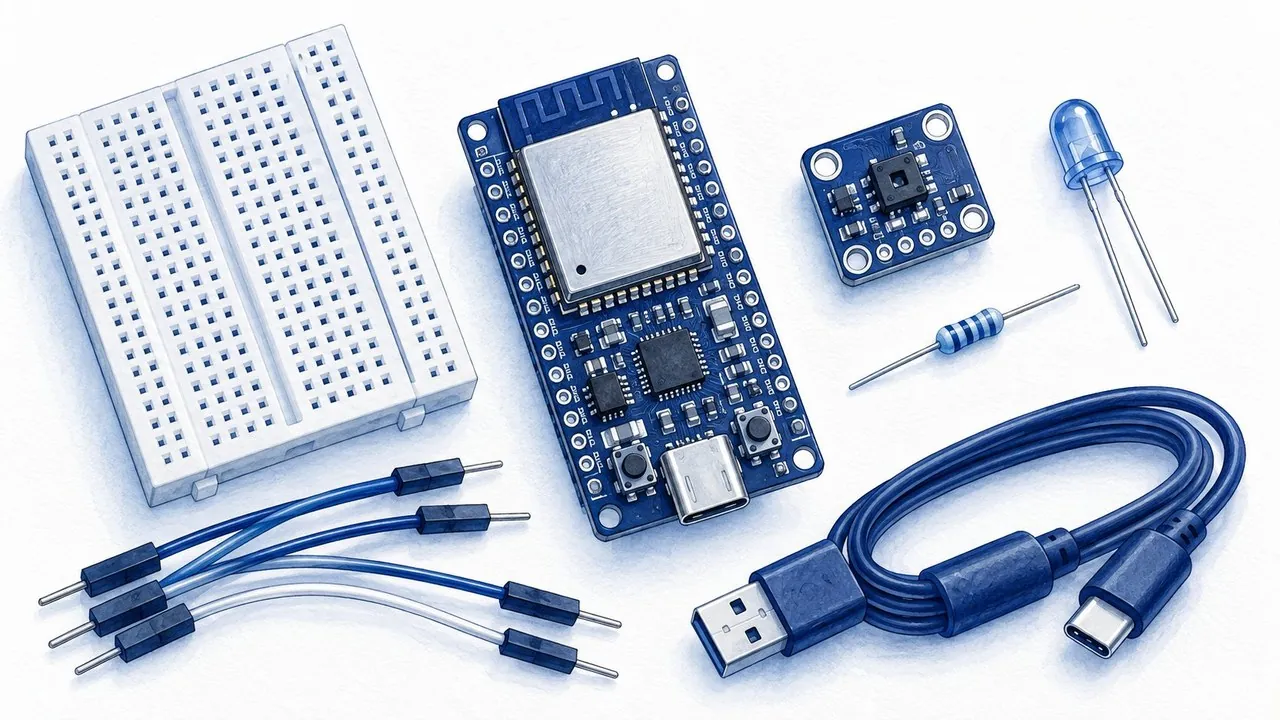
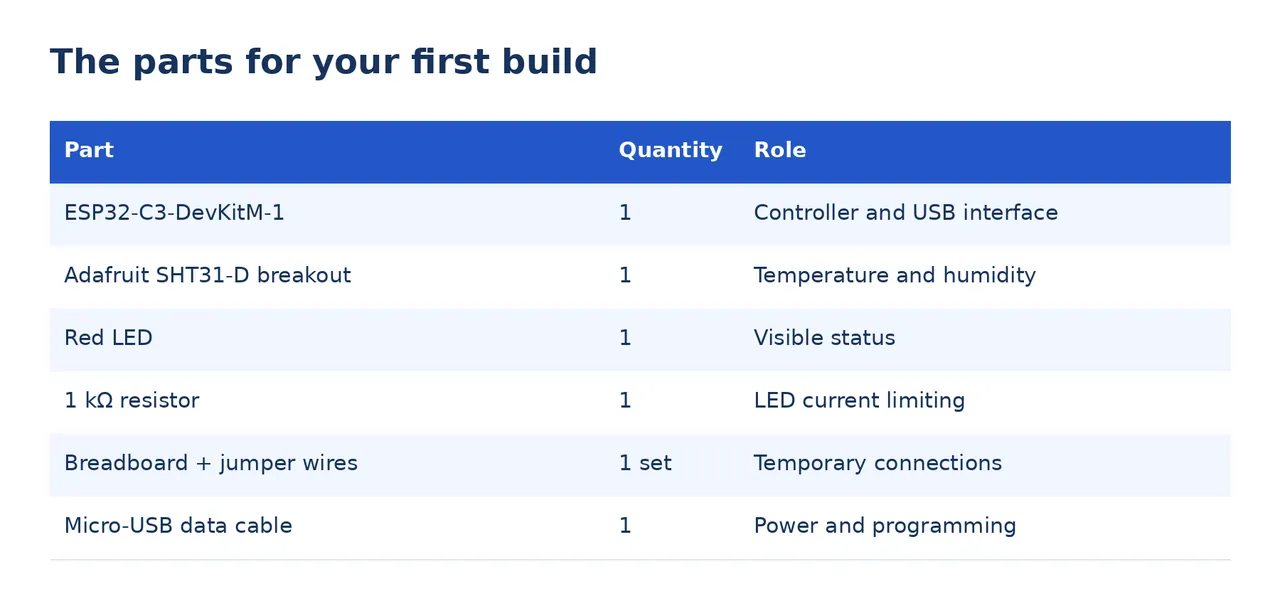
Start with a development board that has a pinout, an upload guide and working examples. The ESP32-C3-DevKitM-1 includes a USB-to-UART bridge and a voltage regulator, and Espressif recommends powering it through Micro-USB. Buy a sensor breakout with soldered headers, or solder the headers before assembly: an unconnected header pressed against a pad is a classic source of intermittent failures that look like software bugs.
| Part | Quantity | Role |
|---|---|---|
| ESP32-C3-DevKitM-1 | 1 | Controller and USB interface |
| Adafruit SHT31-D breakout | 1 | Temperature and humidity |
| Red LED | 1 | Visible status |
| 1 kOhm resistor | 1 | LED current limiting |
| Breadboard + jumper wires | 1 set | Temporary connections |
| Micro-USB data cable | 1 | Power and programming |
The cheapest chip is not the whole project budget: cables, connectors, tools, shipping and an enclosure all count. For this first build, use USB power and leave the screen optional. A multimeter is the one supporting tool worth having, if only to check supply voltage and continuity.
Step 4. Check voltages before connecting signals
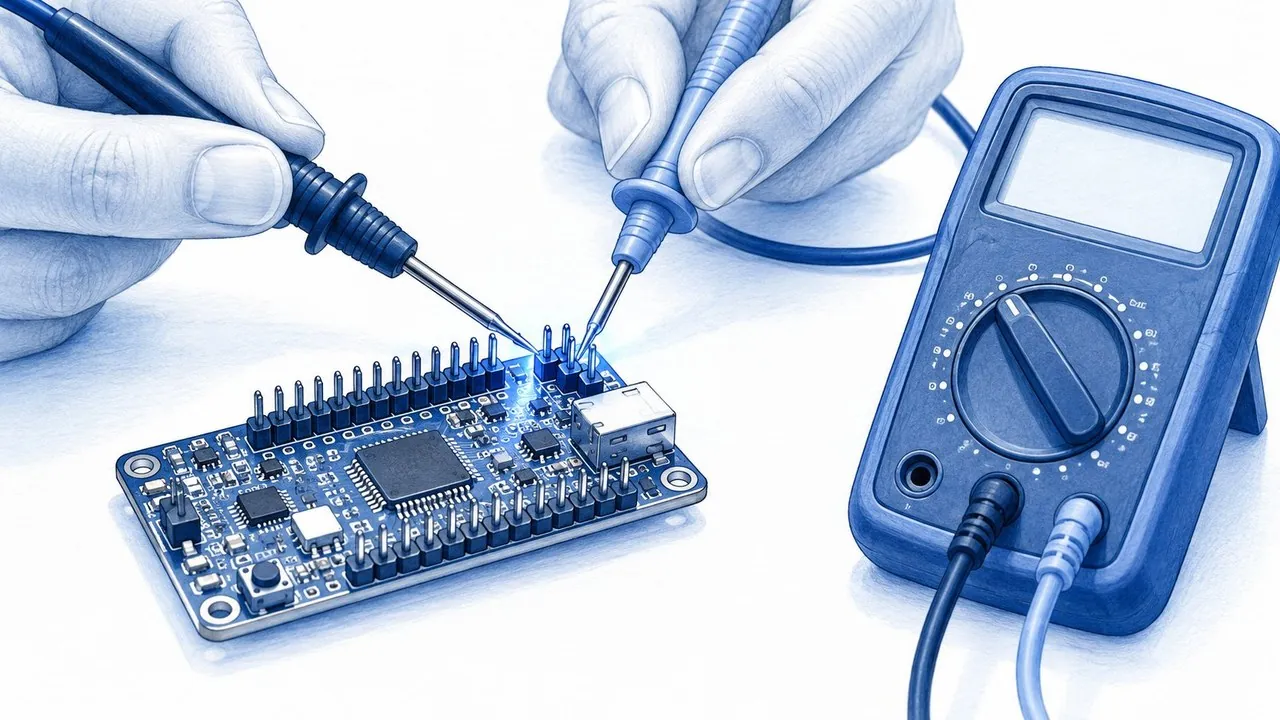
The USB input and the GPIO pins do different jobs. ESP32-C3 GPIO uses 3.3 V logic; do not feed it a 5 V signal, and check the electrical specifications of every module you connect. Power the Adafruit SHT31-D breakout from the board's 3V3 pin so its I2C pull-ups sit at a compatible level, and connect all grounds together.
| Board connection | Connect to |
|---|---|
| 3V3 | SHT31-D VIN |
| GND | SHT31-D GND |
| IO4 / GPIO4 | SHT31-D SDA |
| IO5 / GPIO5 | SHT31-D SCL |
| IO6 / GPIO6 | 1 kOhm resistor, then LED anode |
| GND | LED cathode |
GPIO numbers are not header positions, so work from the wiring table and the board documentation rather than from counting pins. The resistor is not decoration: assuming a 3.3 V output and a 2.0 V LED forward voltage, a 1 kOhm resistor gives about 1.3 mA, from I = (3.3 - 2.0) / 1,000. Real LED forward voltages and GPIO output voltages vary, which is exactly why the calculation is an assumption to check, not a number to trust blindly.
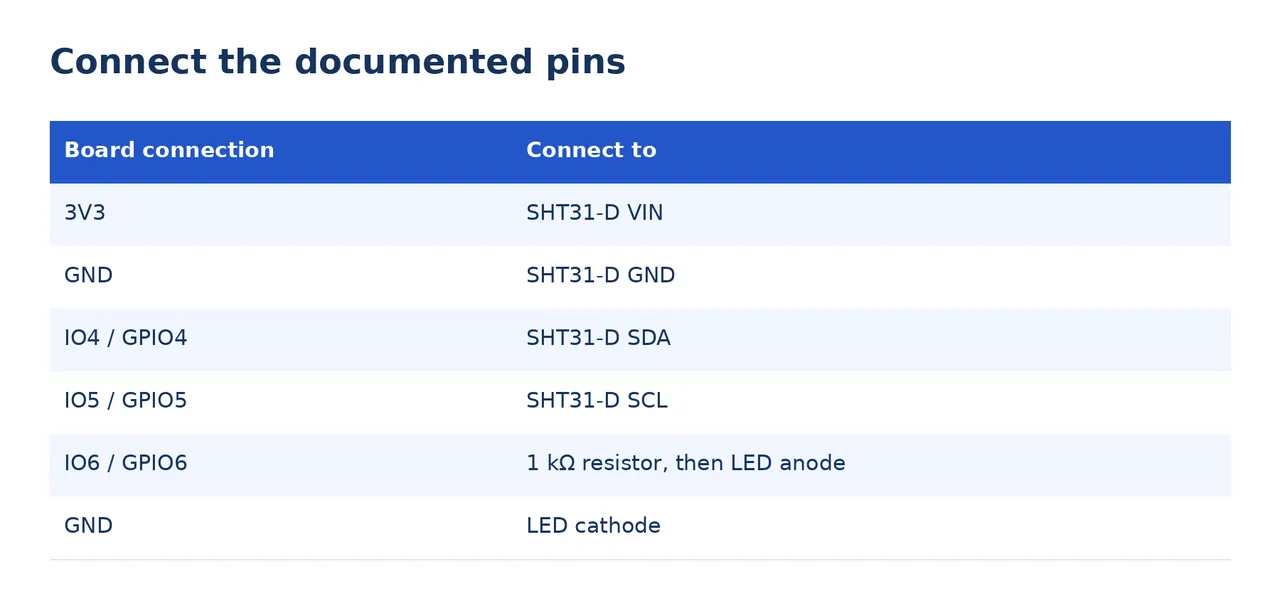
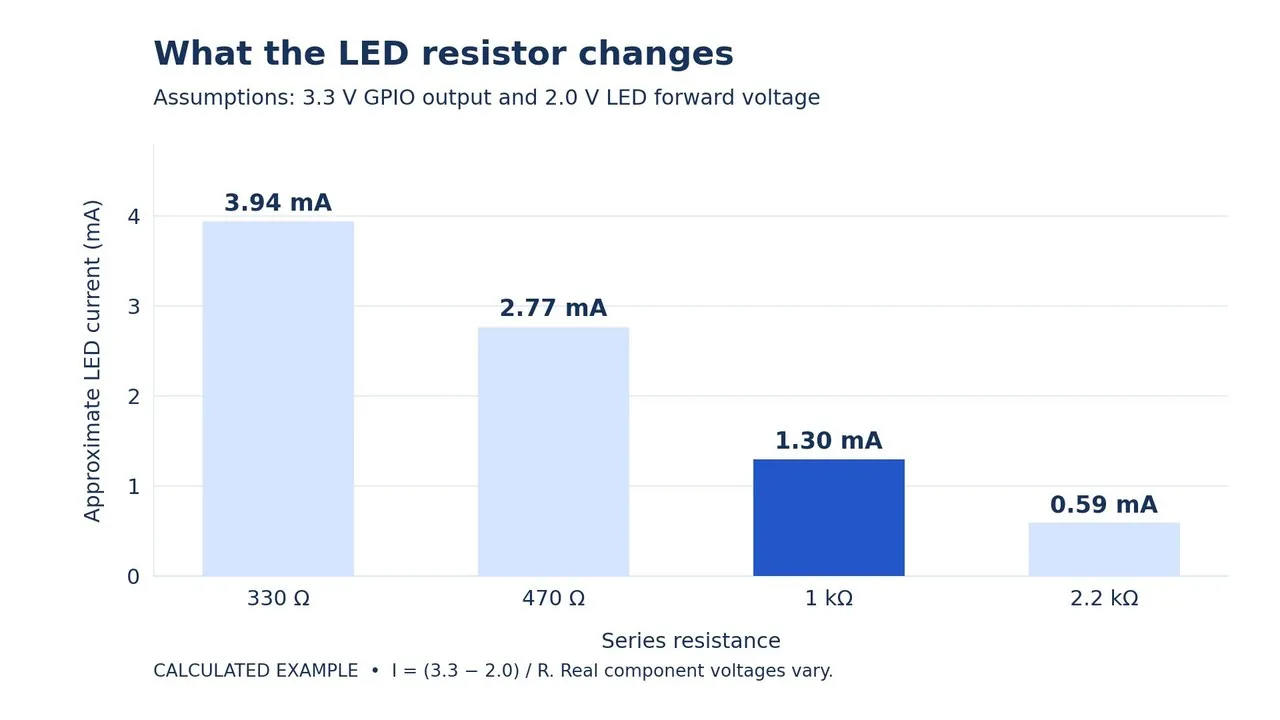
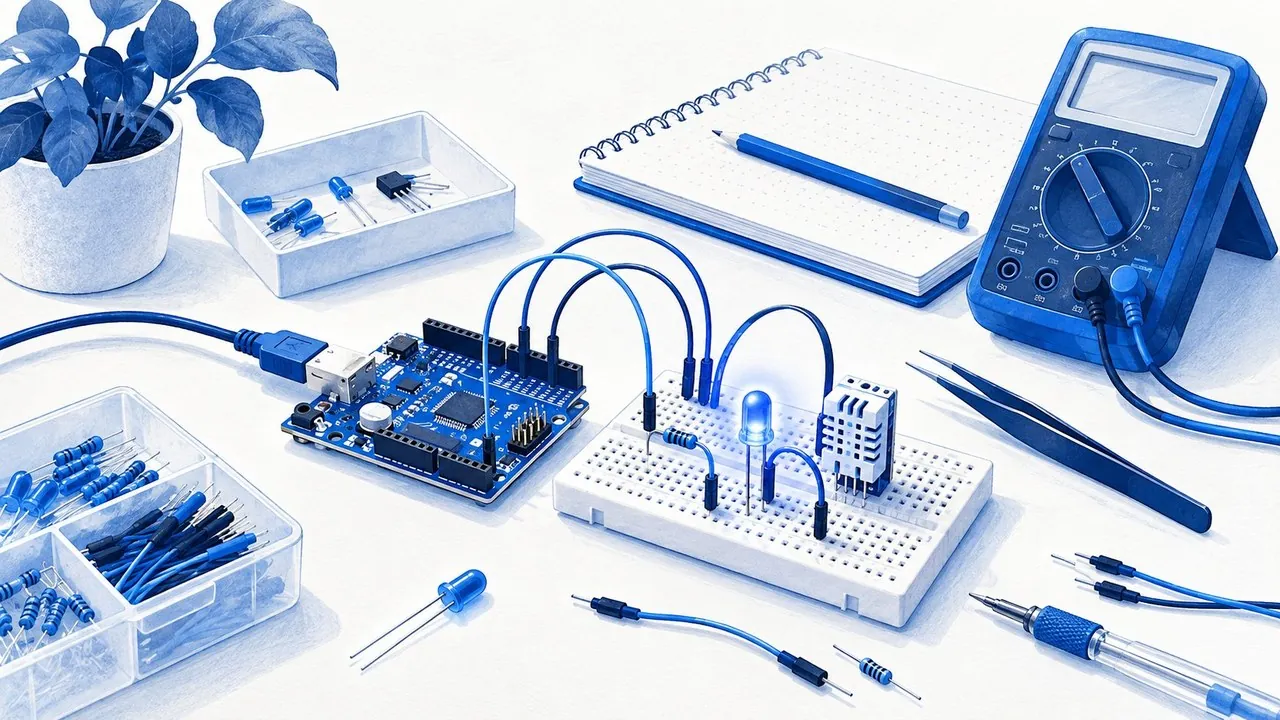
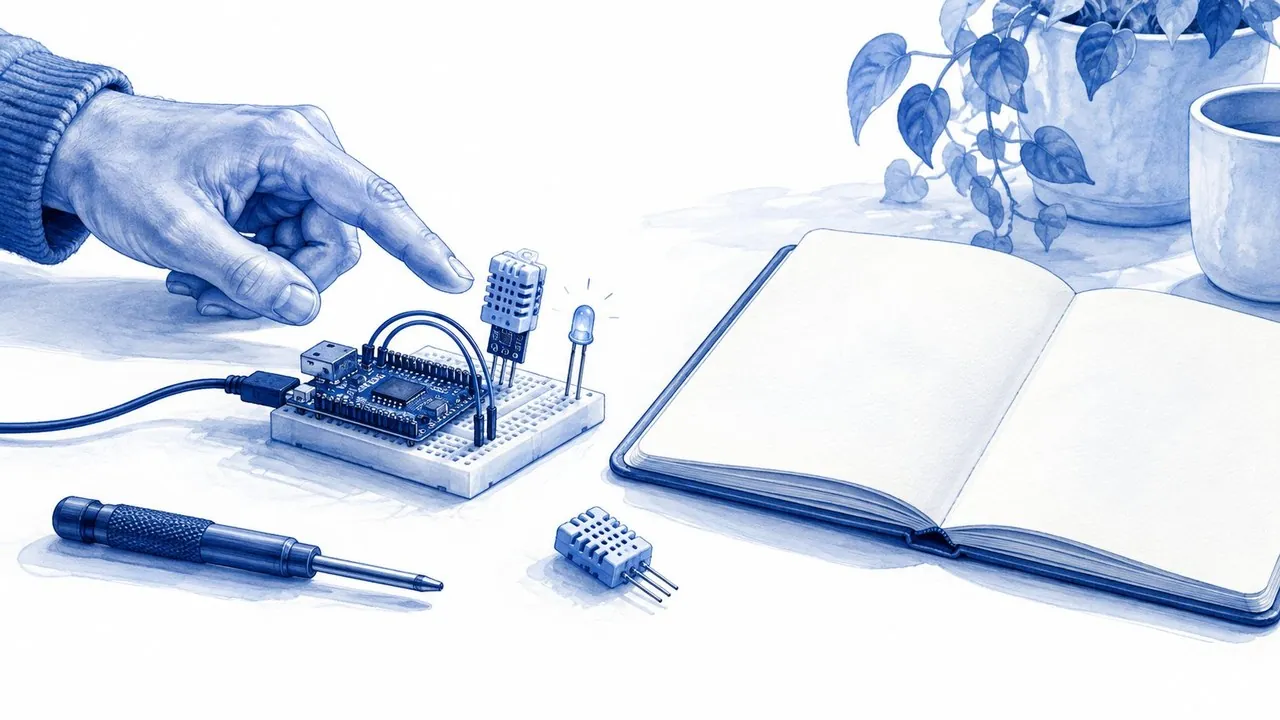
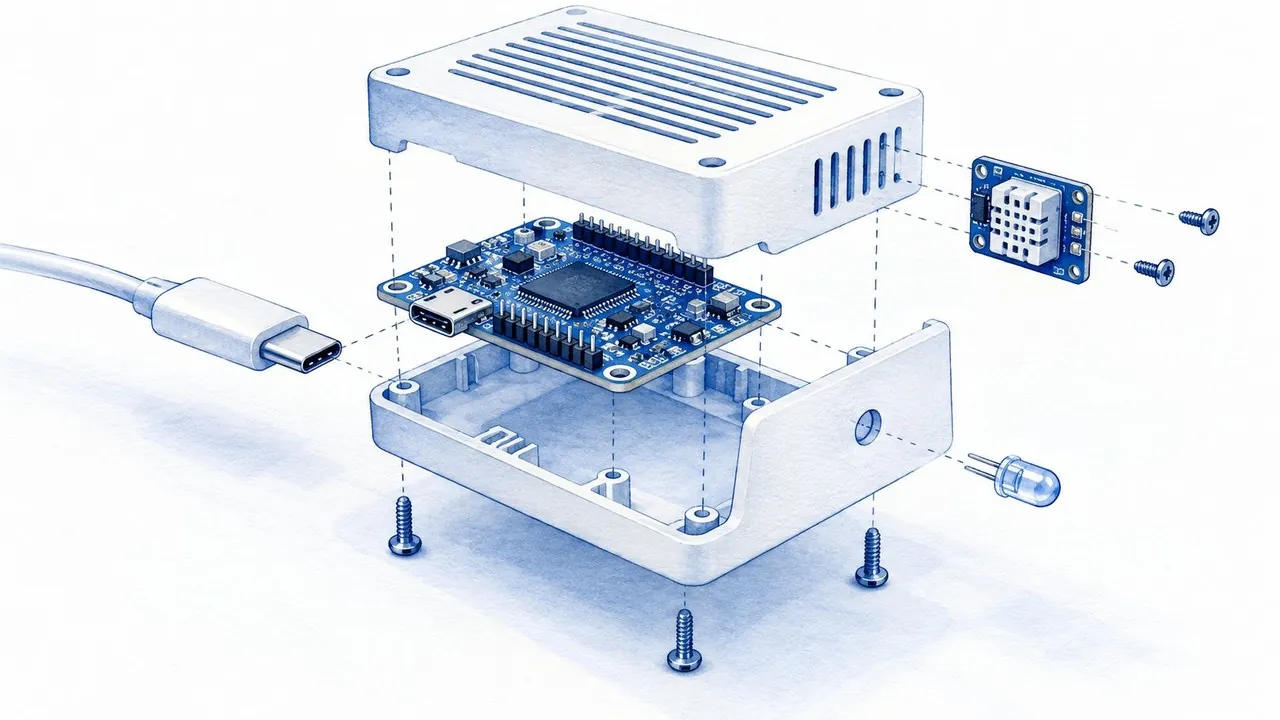
One caveat that saves hours: treat the illustrations in this guide as conceptual scenes. The wiring table and the component documentation are the connection references.
Step 5. Build a prototype you can change
Assemble the circuit with USB disconnected. Check the LED polarity, the shared ground and each jumper against the wiring table, and inspect for shorts before switching on. Then measure the voltage between 3V3 and GND and test one subsystem at a time.
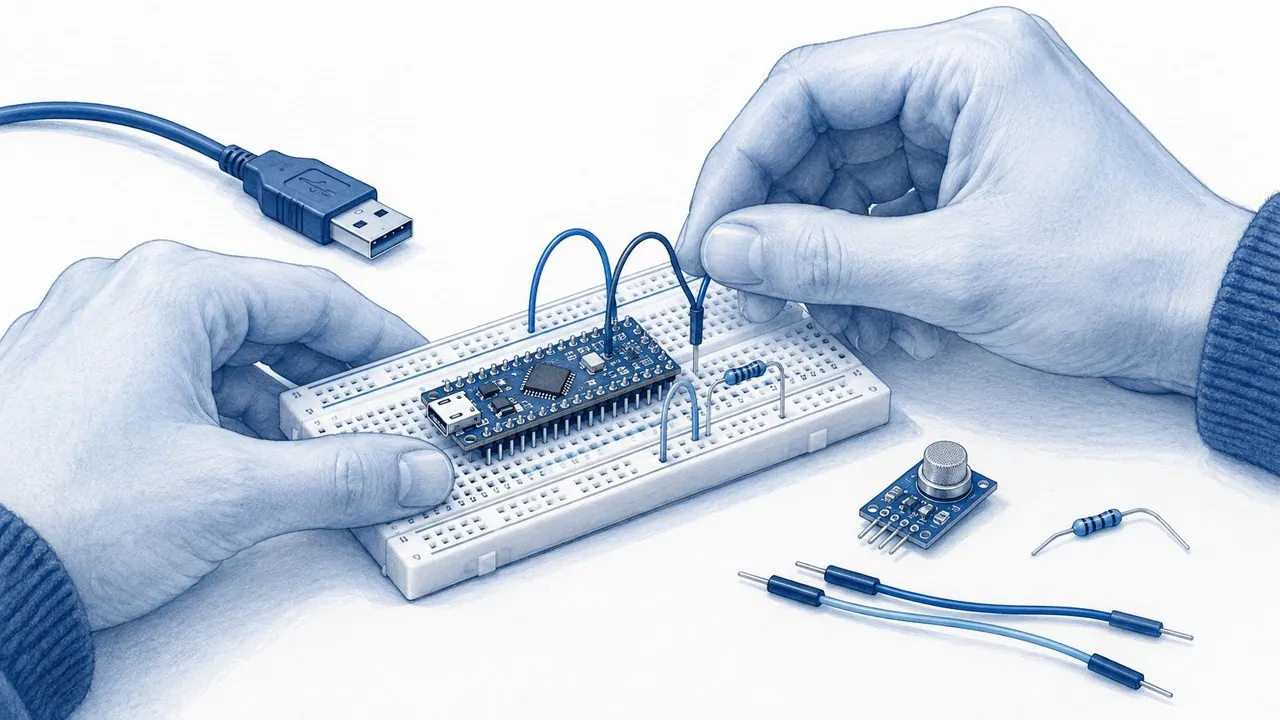
Breadboard power rails can be split halfway along their length. Use a continuity check to confirm that the holes you rely on are connected. Measure resistance or continuity only with power removed.
Keep the prototype accessible: short, traceable wires will save you time when you need to move a connection, and a breadboard is precisely the medium that lets you fix one mistake without rebuilding everything. If a component becomes unexpectedly hot, remove power and investigate before continuing.
- Check the power rails.
- Check the sensor connections.
- Check the LED and resistor.
- Connect USB after the inspection.
Step 6. Make the board talk before adding features
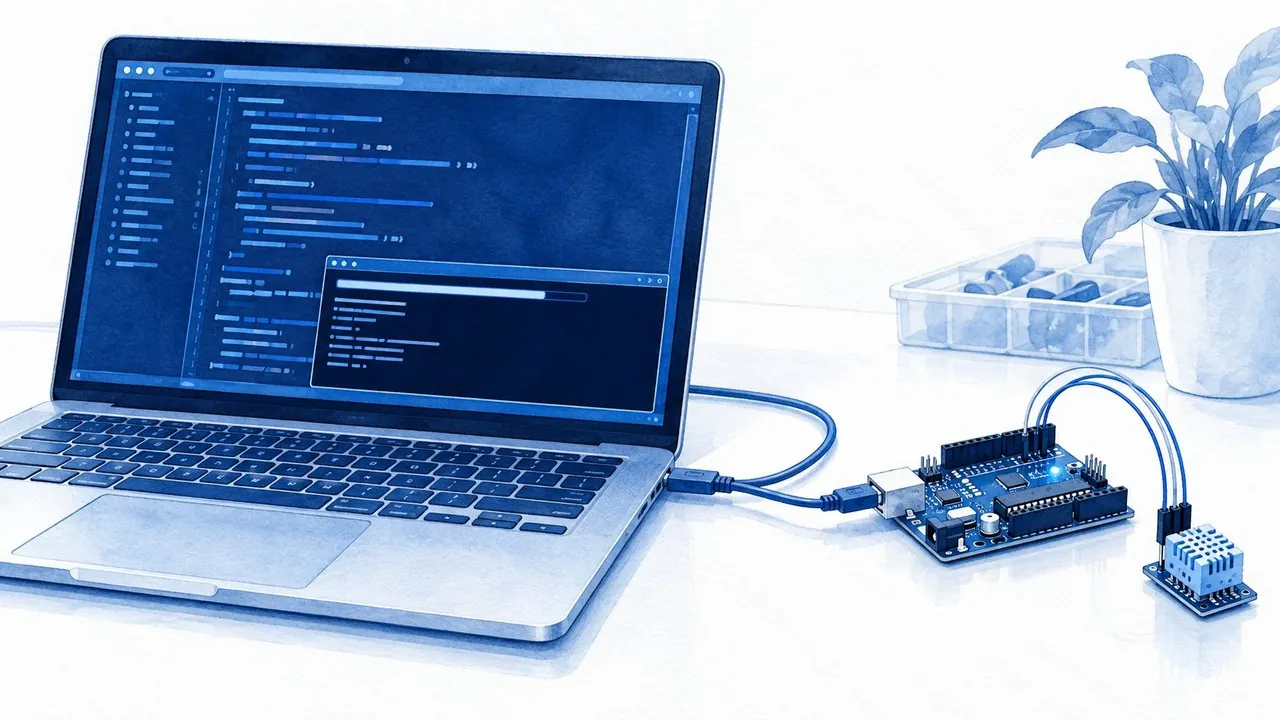
Install the Arduino IDE and the esp32 by Espressif Systems board package using the official guide, then select the appropriate board configuration and serial port; ESP32C3 Dev Module is a suitable configuration for this sketch, using the DevKitM-1's USB-to-UART connection. Upload a tiny program that prints a message. That single step confirms your computer can program the board and receive output, and it isolates the toolchain from everything else that can go wrong later.
Next, install the Adafruit SHT31 library and its dependencies. Explicitly configure SDA as GPIO4 and SCL as GPIO5 before starting I2C. Default I2C pins vary between boards.
The sensor's default address is 0x44; its ADR configuration can change it to 0x45. If the sensor is not found, check the wiring and the address first, not the library. Move on when repeated sensor readings appear in Serial Monitor, and remember the mundane failure mode: a charging-only USB cable cannot carry the programming data.
Scope discipline matters here too. This project measures temperature and relative humidity. It does not measure CO2 and it does not establish overall air quality; a sensor defines what your device knows, and pretending otherwise is how credible prototypes lose credibility.
The reference sketch below implements exactly the behaviour specified in Step 1, with the pins, interval and thresholds from this guide. It is a starting point to compare against, not a substitute for reading the library examples.
#include <Wire.h>
#include <Adafruit_SHT31.h>

const int PIN_SDA = 4;        // GPIO4 -> SHT31-D SDA
const int PIN_SCL = 5;        // GPIO5 -> SHT31-D SCL
const int PIN_LED = 6;        // GPIO6 -> 1 kOhm -> LED anode

const float TEMP_ON  = 30.0;  // warning on at or above
const float TEMP_OFF = 28.0;  // warning off below
const float RH_ON    = 70.0;
const float RH_OFF   = 65.0;
const unsigned long INTERVAL_MS = 2000;

Adafruit_SHT31 sht31;
bool warning = false;
bool sensorOk = false;
unsigned long lastRead = 0;

void setup() {
  Serial.begin(115200);
  pinMode(PIN_LED, OUTPUT);
  Wire.begin(PIN_SDA, PIN_SCL);
  sensorOk = sht31.begin(0x44);       // ADR strap can move this to 0x45
  if (!sensorOk) Serial.println("SHT31 not found: check wiring and address");
}

void loop() {
  if (millis() - lastRead < INTERVAL_MS) return;
  lastRead = millis();

  float t  = sht31.readTemperature();
  float rh = sht31.readHumidity();
  if (!sensorOk || isnan(t) || isnan(rh)) {
    digitalWrite(PIN_LED, (millis() / 250) % 2);   // blink: waiting for data
    Serial.println("read failed, retrying");
    return;
  }

  if (!warning && (t >= TEMP_ON || rh >= RH_ON)) warning = true;
  if (warning && t < TEMP_OFF && rh < RH_OFF)     warning = false;

  digitalWrite(PIN_LED, warning);
  Serial.printf("t=%.2f C  rh=%.1f %%  warning=%d\n", t, rh, warning ? 1 : 0);
}
Step 7. Turn measurements into useful behaviour
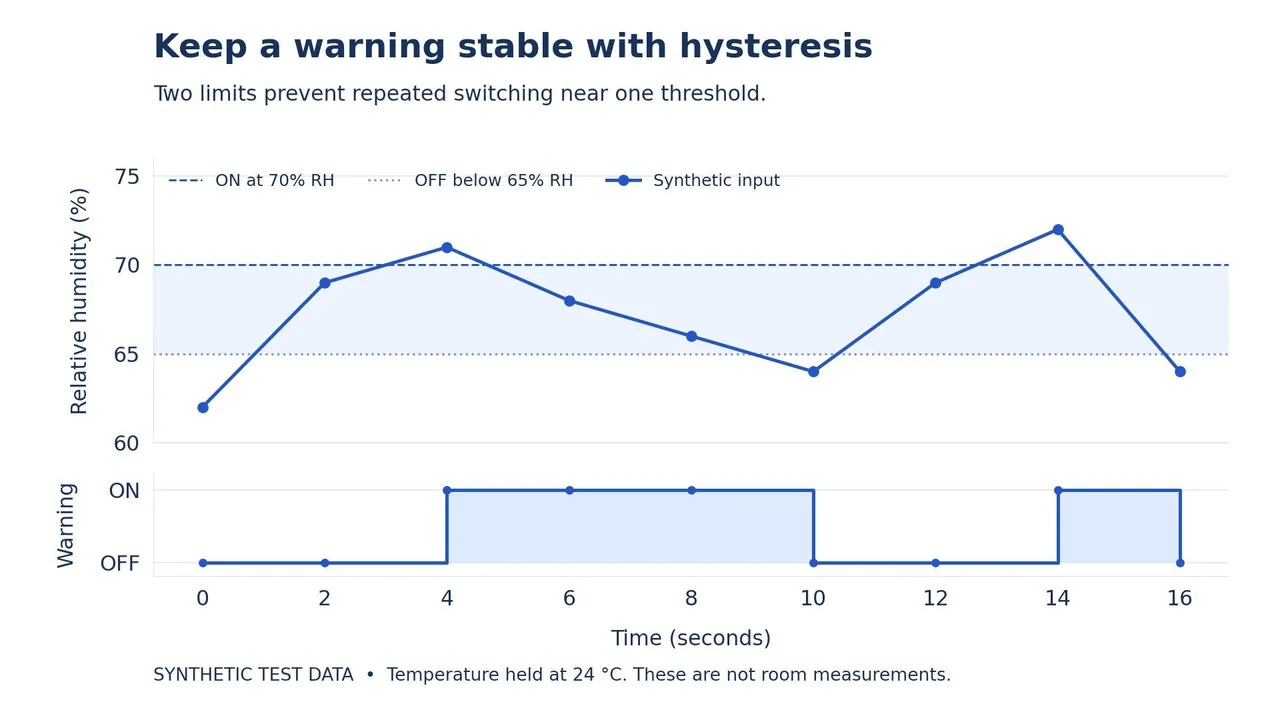
Give the device three clearly different states: normal operation, threshold warning and sensor error. For this example, turn the warning on when temperature reaches 30 C or relative humidity reaches 70%, and turn it off once temperature is below 28 C and humidity is below 65%. Those are demonstration settings, not universal environmental recommendations.
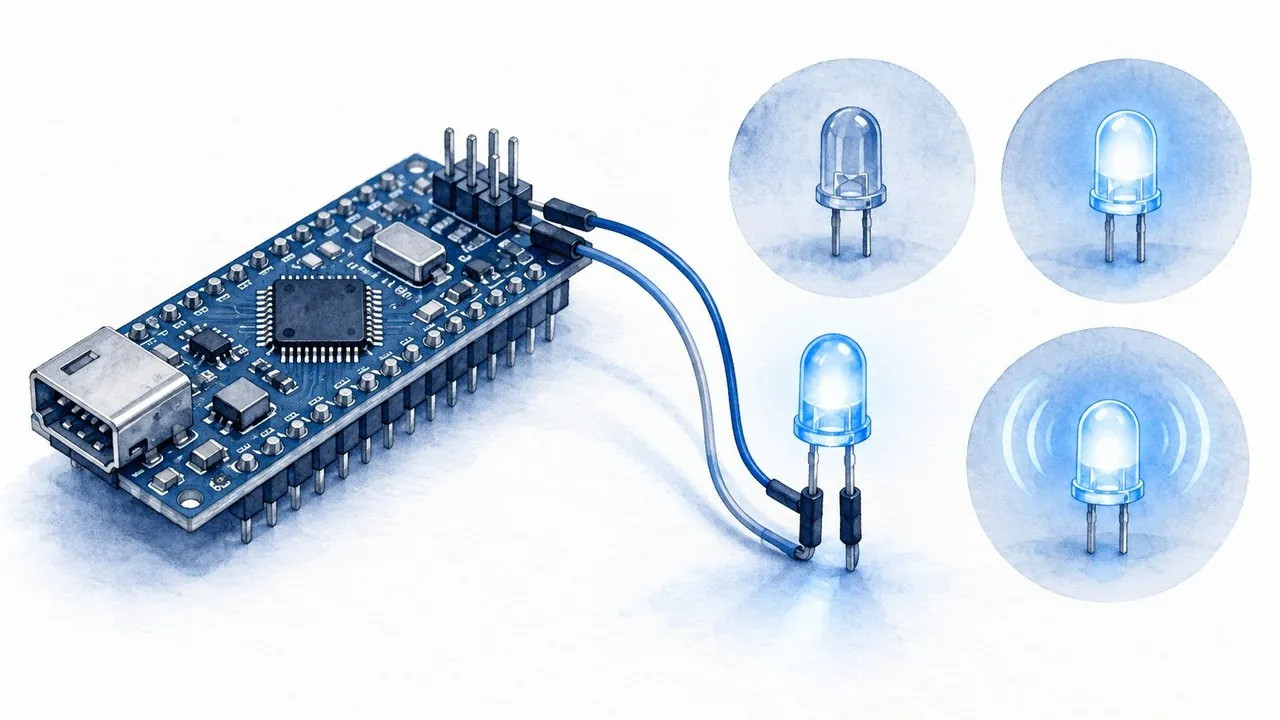
The gap between those limits is hysteresis, and it is the quiet professional detail in this whole build: it keeps the LED from repeatedly switching as a measurement wanders around one threshold. The chart below isolates humidity while temperature stays at 24 C. At 71% the warning turns on. At 68% it stays on, inside the band. At 64% it turns off. Every point is a synthetic test value, which is the point: you can exercise the logic without changing the room.
stateDiagram-v2
  [*] --> Normal: first valid reading
  Normal --> Warning: temperature reaches 30 C or humidity reaches 70 percent
  Warning --> Warning: reading inside the hysteresis band
  Warning --> Normal: below 28 C and below 65 percent
  Normal --> Error: sensor read fails
  Warning --> Error: sensor read fails
  Error --> Normal: valid reading returns below limits
  Error --> Warning: valid reading returns inside warning range
If a read fails, show an error and retry. Do not display a failed measurement as a fresh zero: a zero that looks like data is worse than no data, and the rule generalises far beyond LEDs, since motors, heaters and other substantial loads need an appropriate driver and power supply rather than a GPIO pin and hope.
- LED off: a valid reading is below the warning state.
- LED on: the threshold warning is active.
- LED blinking: the device is waiting for valid sensor data.
Step 8. Test the cases your first demo misses
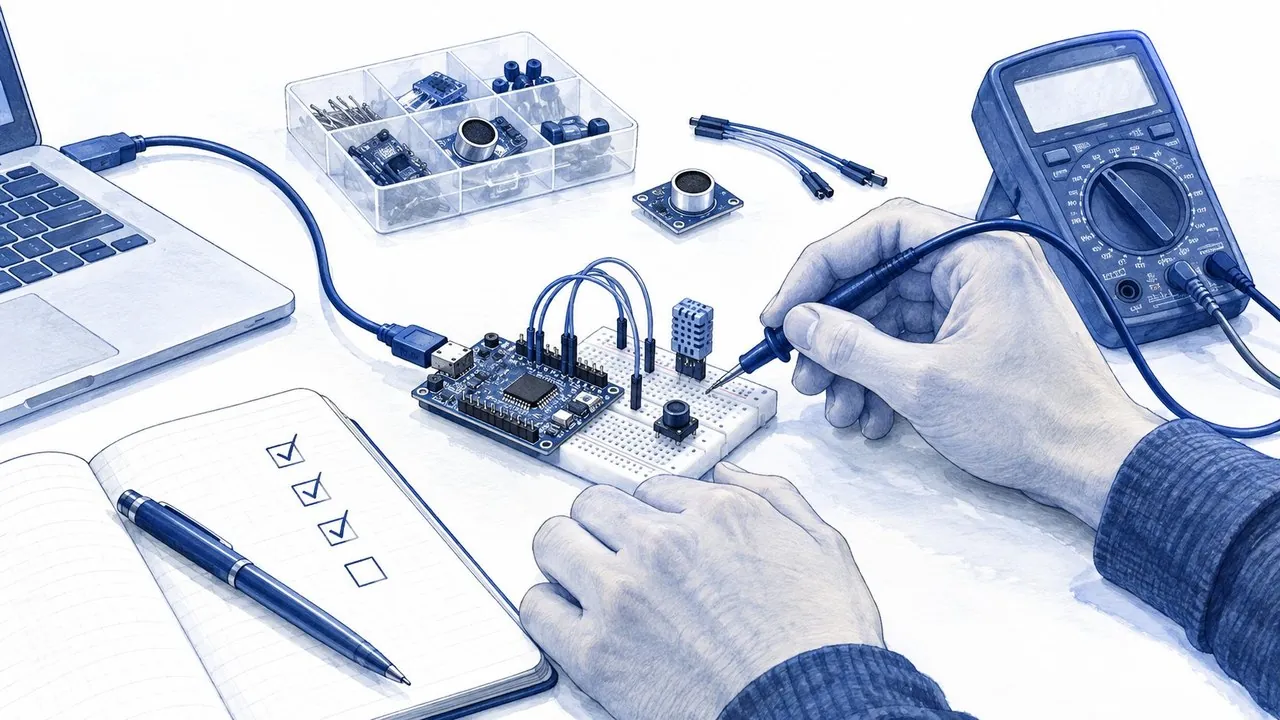
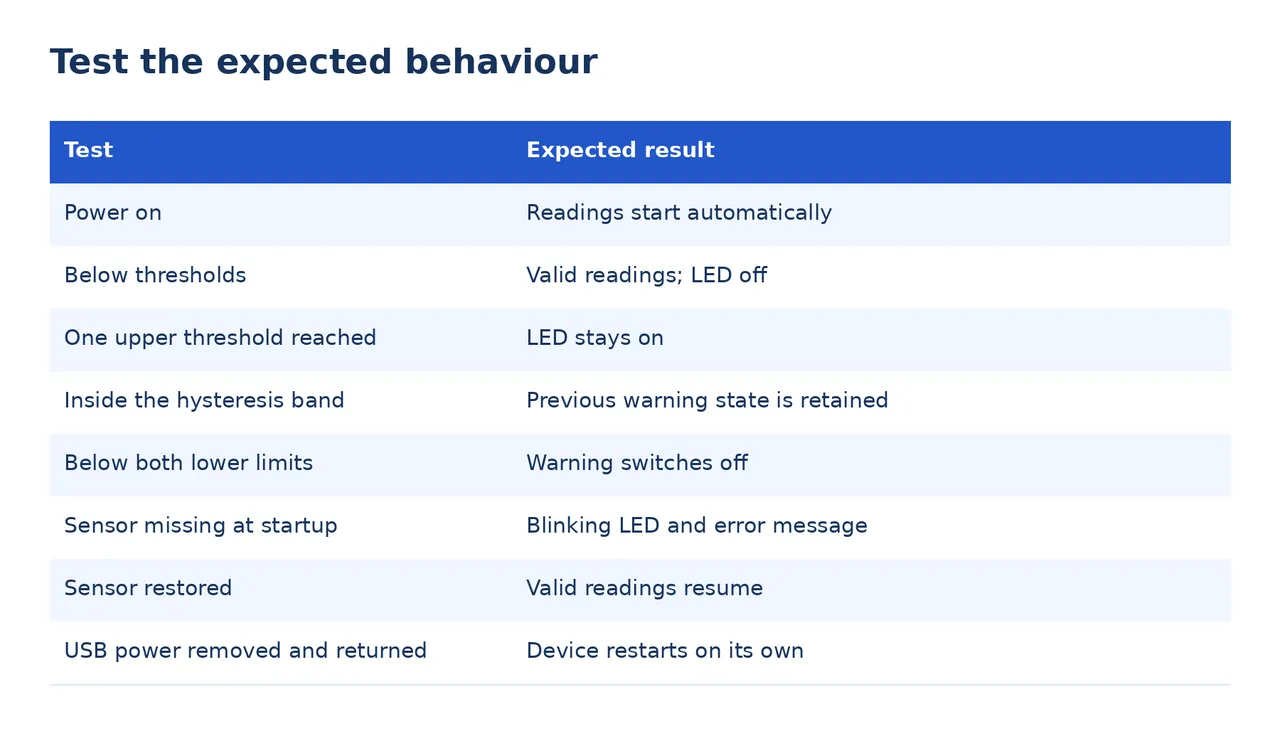
A successful first run is a starting point, not a result. Repeat the conditions that matter, including restarts and missing inputs. Disconnect power before physically changing the wiring, and use software test values to exercise the threshold logic without changing the room's humidity. Record what you expected and what actually happened: a device that freezes after an error still needs work, even if the normal demonstration looks convincing. Compare readings with a known instrument under similar conditions; a simple comparison can reveal a problem, but it does not replace calibration. And passing a test means observing the expected behaviour. Writing the test down is only the preparation.
| Test | Expected result |
|---|---|
| Power on | Readings start automatically |
| Below thresholds | Valid readings; LED off |
| One upper threshold reached | LED stays on |
| Inside the hysteresis band | Previous warning state is retained |
| Below both lower limits | Warning switches off |
| Sensor missing at startup | Blinking LED and error message |
| Sensor restored | Valid readings resume |
| USB power removed and returned | Device restarts on its own |
Step 9. Build an enclosure around the measurement
Secure the modules and connectors, or transfer the circuit to soldered perfboard. Moving the device should not pull a jumper loose.
A temperature and humidity sensor needs access to the environment you want to measure. Keep it away from warm electronics and provide ventilation; a sealed box can make it report the conditions inside the enclosure, which is a measurement of your case, not your room. Retest after installing the case, because mechanical changes can affect connections, airflow and the readings.
A custom PCB becomes useful when the circuit is stable and you need compactness or repeatable assembly. KiCad provides design-rule checks and manufacturing outputs, but a clean DRC result does not prove that your device performs its intended task; it proves the drawing is consistent.
Step 10. Document the build and show it working
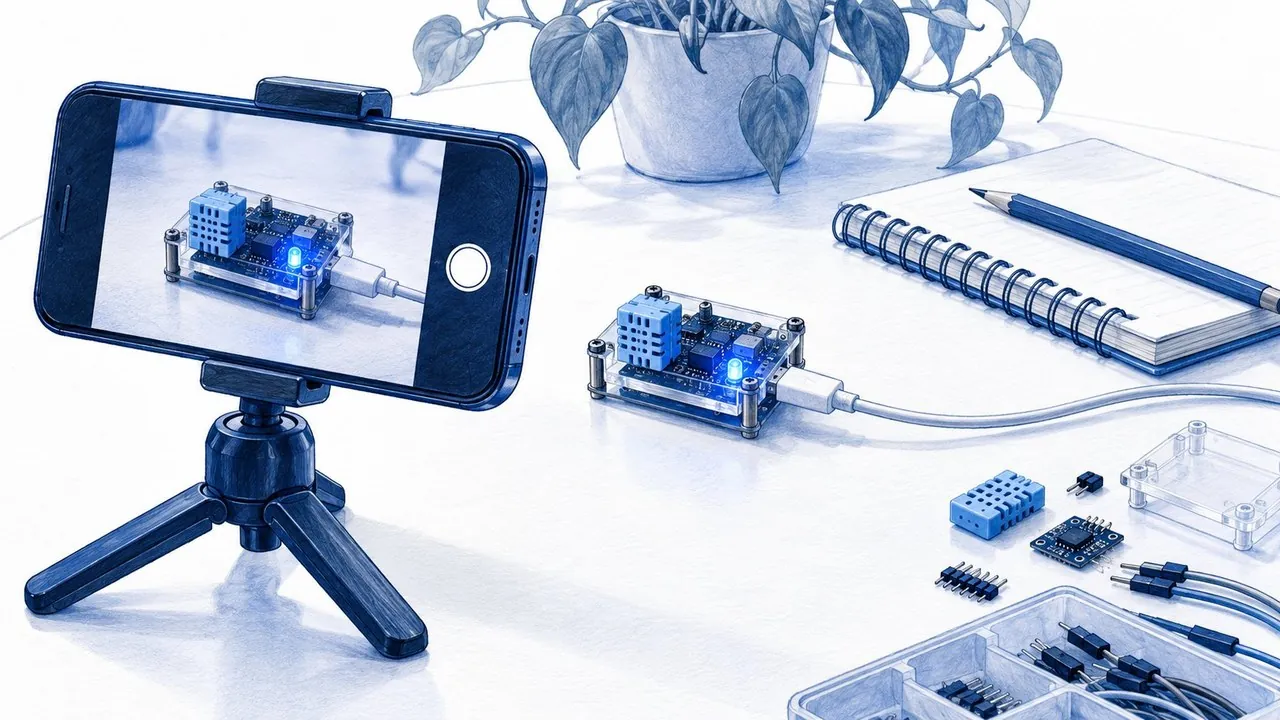
Save the source code, exact part names, pin connections, library versions and test results. Add the upload instructions and explain how to change the thresholds. Then apply the only test of documentation that matters:
Try rebuilding from those notes after a few weeks. If you can repeat the result without relying on memory, your documentation is doing its job.
When you show the device, open with the function: show the reading, trigger the condition and show the response, then reveal the hardware. Name the board and the sensor, explain one useful design choice, and link the files needed to reproduce it. A visible result gives the reader something concrete to judge. That is an editorial recommendation, not a promise of algorithmic reach.
- Show what the device does.
- Name the board and sensor.
- Explain one useful design choice.
- Link the files needed to reproduce it.
What you have when these steps are done
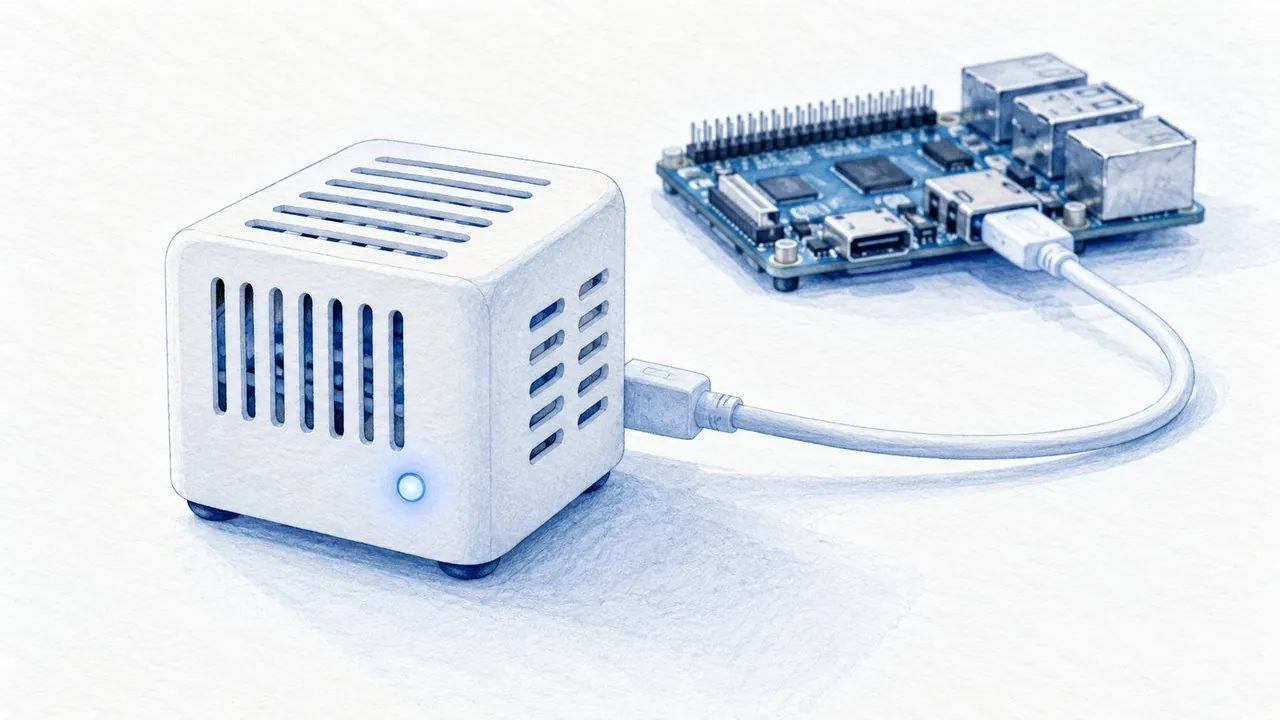
You have a device with a defined job, a known set of connections, and behaviour you have checked under normal and failure conditions. That is more than a demo; it is a foundation. Choose the next feature by asking what is missing in actual use: a display removes the need for a computer, logging shows changes over time, and a battery adds mobility together with a whole new power-management problem.
Your first useful device can be small. What matters is that you can explain it, rebuild it and trust its behaviour within the conditions you tested. So the question worth sitting with is a practical one: what would you build first, a desk sensor, a small display or a physical control?
Sources and visual notes
- Muse Gadgets announcement on X, natfriedman
- Muse Gadgets official site and device SDKs, gadgets.muse.ai
- M5Stack PaperMono announcement on X, M5Stack
- Meshtastic modular nodes announcement, Meshtastic
- Espressif ESP-DL getting started, docs.espressif.com
- ESP32-C3-DevKitM-1 user guide, docs.espressif.com
- ESP32-C3 datasheet, documentation.espressif.com
- Adafruit SHT31-D wiring and library guide, learn.adafruit.com
- Arduino ESP32 installation, docs.espressif.com
- Arduino ESP32 I2C API, docs.espressif.com
- KiCad PCB Editor documentation, docs.kicad.org
The scene illustrations in this article are conceptual renderings; the wiring table and the component documentation above are the connection references. The three charts are calculated or synthetic examples, labelled as such in each caption.
Source: "Build your own Working Hardware in 10 simple steps" by Psalter (@Psalteric) on X, published 2026-10-09.
Source:Psalter (X)https://x.com/Psalteric/status/2108663682561364159