PAPER DEEP DIVE
VTLoc: Learning-based Tactile Contact Localization in Visual Point Clouds
Vision and touch are complementary modalities essential for robotic perception and manipulation. While vision provides global object context, touch offers precise local information at contact points. Integrating these modalities for contact localization, i.e., predicting the location of touch on an object's surface, poses significant challenges due to the need for accurate spatial alignment between tactile data and visual geometry. To address this challenge, we propose VTLoc, a novel visual-tactile framework that localizes contact points from tactile readings using a 3D point cloud as visual input. VTLoc introduces two key components: a geometric multi-modal alignment module, which reconstructs a pseudo-point cloud from fused visual-tactile features and aligns it with the visual point cloud to enforce spatial consistencies across modalities; and an iterative localizing updater, which iteratively refines the predicted contact location using fused visual-tactile features. Evaluated on a new benchmark of 100 real-world objects, VTLoc improves single-touch contact localization by reducing local-to-global correspondence ambiguity.
VTLoc: Learning-based Tactile Contact Localization in Visual Point Clouds
Paper: VTLoc: Learning-based Tactile Contact Localization in Visual Point Clouds
Authors: Zhiyuan Wu, Zhuo Chen, Shan Luo (King's College London)
Link: arXiv:2607.16146 | Code: georgewuzy.github.io/vtloc-website/ | Sensor: GelSight
One-line summary: Predicting 3D object surface contact locations from 2D tactile images via a geometric multi-modal alignment module that reconstructs pseudo-point clouds to align with visual point clouds, plus an iterative localizing updater for progressive contact coordinate refinement—outperforming all baselines on a 100-object real-world benchmark.
Background and Motivation
Vision and touch are complementary modalities for robotic perception and manipulation. Vision provides global object context (shape, texture, spatial relationships), while touch offers precise local information at contact points (surface geometry, contact forces). Given an object's visual representation (mesh or point cloud), predicting where contact occurs on the surface from tactile readings—contact localization—is crucial for accurate object recognition, manipulation, and interaction. Single-touch contact localization provides initial estimates for multi-touch and sequential tactile localization frameworks.
Existing methods divide into same-dimensional and cross-dimensional matching. Same-dimensional approaches share input-output dimensionality (e.g., 2D tactile images to 2D visual image contact points, or 3D tactile point clouds to 3D surfaces). Cross-dimensional matching is more challenging—requiring mappings across different spatial dimensions, like localizing 2D tactile images in 3D scenes. Prior cross-dimensional work relies on strong data priors: MidasTouch builds a large tactile codebook from 50,000 randomized sensor poses per object mesh, limiting real-world scalability. It also has only 10 objects with 5 trajectories each.
VTLoc's core idea: directly learn to predict contact locations from 2D tactile images and 3D point clouds without dense object-specific sampling. Inspired by human perception—where internal object representations are formed and refined through sensory feedback—it introduces a Geometric Multi-modal Alignment (GMA) module and an Iterative Localizing Updater (ILU).
Method
1. Problem Setting
The system receives two inputs: (1) a tactile image $\boldsymbol{T}\in\mathbb{R}^{H\times W\times 3}$; (2) an object 3D point cloud $\boldsymbol{P}\subset\mathbb{R}^{3}$ with $N^p$ points, each $\boldsymbol{p}=(x,y,z)$ with normal $(n_x,n_y,n_z)$. The contact point is defined as the projection of the tactile sensor center onto the mesh along the surface normal. The goal is to predict contact coordinates $\boldsymbol{c}^p$ and a 3D contact probability map $\boldsymbol{P}^s=\{(\boldsymbol{p},s_{\boldsymbol{p}})\mid\boldsymbol{p}\in\boldsymbol{P}\}$, where $s_{\boldsymbol{p}}$ is the predicted likelihood of point $\boldsymbol{p}$ being the actual contact location.
2. Network Overview
The tactile input is encoded by ResNet-18 + flattening MLP into $\boldsymbol{F}^t\in\mathbb{R}^{C}$; the point cloud by PointNet++ into $\boldsymbol{F}^p\in\mathbb{R}^{C}$. The fused features feed into GMA and ILU modules. GMA aligns fused features in 3D space to enforce cross-modal geometric consistency; ILU performs iterative regression to refine contact location $\boldsymbol{c}^p$.
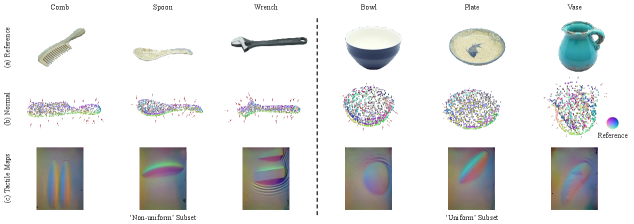
Figure 3: VTLoc workflow. The GMA module enhances geometric consistency by minimizing Chamfer distance between pseudo-point cloud and original. The ILU performs iterative contact prediction refinement.
3. Geometric Multi-Modal Alignment (GMA)
Inspired by human contact localization—mentally reconstructing an object then iteratively matching the touched region. GMA reconstructs a pseudo-point cloud $\boldsymbol{P}^d$ from fused features $\boldsymbol{F}^f=[\boldsymbol{F}^t,\boldsymbol{F}^p]$ through learned weights $\boldsymbol{W}^d\in\mathbb{R}^{N^d\times 2C\times C^d}$:
$$\boldsymbol{F}^{d}(j,l)=\sum\boldsymbol{F}^{f}(i)\cdot\boldsymbol{W}^{d}(i,j,l)$$
An MLP decodes each feature in $\boldsymbol{F}^d$ into a 3D point with normal $\boldsymbol{p}^d=[x^d,y^d,z^d,n_x^d,n_y^d,n_z^d]$. Reconstruction loss via Chamfer Distance:
$$\mathcal{L}^{recon}=\sum_{\boldsymbol{p}^{d}\in\boldsymbol{P}^{d}}\min_{\boldsymbol{p}\in\boldsymbol{P}}\|\boldsymbol{p}^{d}-\boldsymbol{p}\|^{2}+\sum_{\boldsymbol{p}\in\boldsymbol{P}}\min_{\boldsymbol{p}^{d}\in\boldsymbol{P}^{d}}\|\boldsymbol{p}-\boldsymbol{p}^{d}\|^{2}$$
This enforces spatial alignment between tactile and point-cloud modalities in both coordinates and normals, enhancing 3D geometric understanding of fused modalities.
4. Iterative Localizing Updater (ILU)
Inspired by humans refining contact localization by comparing current feedback against stored tactile memory. ILU starts from $\hat{\boldsymbol{c}}_0=\boldsymbol{0}$, predicting a sequence of contact locations over $N$ iterations. At step $k$:
$$\hat{\boldsymbol{c}}_{k+1}=\hat{\boldsymbol{c}}_{k}+\Delta\hat{\boldsymbol{c}}$$
ILU uses a linear GRU. Initial hidden state $\boldsymbol{h}_0=\mathcal{T}(\boldsymbol{F}^t)$ (tanh). Hidden state update:
$$\boldsymbol{h}_{k+1}=(\boldsymbol{1}-\boldsymbol{z}_{k})\odot\boldsymbol{h}_{k}+\boldsymbol{z}_{k}\odot\boldsymbol{q}_{k}$$
Update gate $\boldsymbol{z}_k=\sigma(\text{Linear}^z([\boldsymbol{h}_k,\boldsymbol{x}]))$, candidate $\boldsymbol{q}_k=\mathcal{T}(\text{Linear}^q([\boldsymbol{r}_k\odot\boldsymbol{h}_k,\boldsymbol{x}]))$, reset gate $\boldsymbol{r}_k=\sigma(\text{Linear}^r([\boldsymbol{h}_k,\boldsymbol{x}]))$, input $\boldsymbol{x}=[\boldsymbol{F}^p,\text{ReLU}(\boldsymbol{F}^t)]$. Sequence loss with exponentially increasing weights:
$$\mathcal{L}^{seq}=\sum_{i=1}^{N}\gamma^{N-i}\left\|\boldsymbol{c}^{gt}-\boldsymbol{c}_{i}\right\|$$
with $\gamma=0.9$. Total loss $\mathcal{L}=\mathcal{L}^{seq}+\lambda\mathcal{L}^{recon}$, $\lambda=1$.
graph TD
  A[Tactile Image T] --> B[ResNet-18 + MLP]
  B --> C[Tactile Feature F_t]
  D[Point Cloud P] --> E[PointNet++]
  E --> F[Visual Feature F_p]
  C --> G[Fused Feature F_f]
  F --> G
  G --> H[GMA: Reconstruct Pseudo P_d]
  H --> I[Chamfer Dist Align P]
  C --> J[ILU: Iterative GRU]
  F --> J
  J --> K[Contact Location c_p]
  K --> L[Top-K Candidate Matching]
  L --> M[3D Probability Heat-map]
  style H fill:#f5a623,stroke:#b97316,color:#fff
  style J fill:#4a90d9,stroke:#2c5f8a,color:#fff
  style M fill:#7ed321,stroke:#4a8a14,color:#fff
5. Contact Probability Calculation
For each candidate in $\boldsymbol{S}^c$, compute score $S_{\boldsymbol{c}^*_i}=\|\boldsymbol{c}^p-\boldsymbol{c}^*_i\|^2$, select Top-K. For each point $\boldsymbol{p}$, find nearest candidate and compute weighted score:
$$s_{\boldsymbol{p}}=\frac{1}{w}e^{-\left\|\boldsymbol{p}-\boldsymbol{c}^{*}_{w}\right\|}$$
Normalized to produce 3D probability heat-map $\hat{\boldsymbol{P}}$.
Experimental Results
Benchmark Dataset
Built on ObjectFolder Real with 100 real-world objects. Each object has 30-50 contact locations, 7:3 train-test split. Point clouds sampled at 1024 points with coordinates and normals. Tactile data collected with Franka Emika Panda + GelSight (sensing area $32\times24$ mm²), safe penetration ~1.0mm. Objects divided into "non-uniform" (16 objects: comb, spoon, fork, wrench) and "uniform" (84 objects) subsets by normal variation.
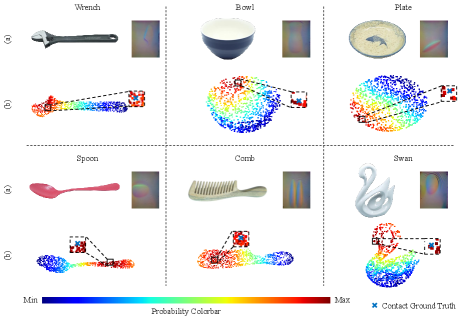
Figure 4: Benchmark data examples. 100 daily objects with resampled position and normal point clouds, 30-50 contact locations per object.
Non-Uniform Subset Comparison
| Method | Coord | Normal | mm Error↓ | ND(%)↓ | Top-1 Acc(%)↑ | Top-5 Acc(%)↑ | MPE↓ |
|---|---|---|---|---|---|---|---|
| Point Filtering | ✓ | 71.81 | 35.78 | 11.32 | 54.09 | 0.2788 | |
| MCR | ✓ | 46.82 | 24.02 | 27.04 | 78.62 | 0.1441 | |
| MidasTouch | — | — | 50.01 | 26.74 | 36.48 | 76.73 | 0.1594 |
| VTLoc (ours) | ✓ | 39.24 | 20.91 | 37.74 | 84.28 | 0.1117 | |
| VTLoc (ours) | ✓ | ✓ | 37.57 | 20.17 | 44.65 | 86.16 | 0.1037 |
VTLoc reduces ND by 14.87% vs Point Filtering and 3.11% vs MCR. Top-5 Acc improves 30.19% vs Point Filtering and 5.66% vs MCR. Adding normals further boosts Top-1 Acc from 37.74% to 44.65%.
| Subset | # Objects | Characteristics | Normals Effect |
|---|---|---|---|
| Non-uniform | 16 | Distinct curvature variation (comb, spoon, etc.) | Improves performance |
| Uniform | 84 | Uniform curvature variation | Degrades performance |
Uniform Subset Comparison
VTLoc also significantly improves on uniform-surface objects: ND reduced 12.11% vs Point Filtering and 10.01% vs MCR. Top-5 Acc improves 9.16% vs MidasTouch. However, overall performance is lower than the non-uniform subset due to inherent geometric ambiguity. Notably, adding normals degrades performance on the uniform subset—uniform objects' geometric information doesn't provide meaningful cues for tactile localization.
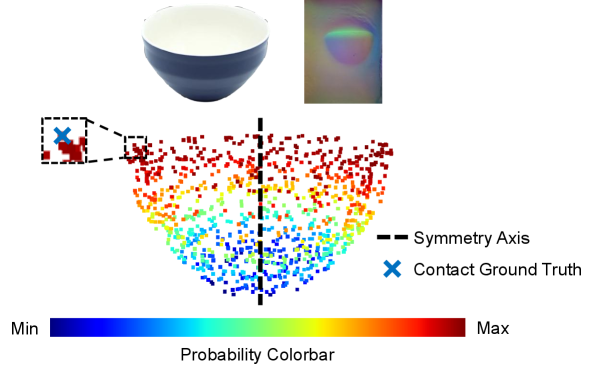
Figure 5: Contact probability qualitative results. VTLoc robustly connects visual and tactile modalities even on complex geometries like the swan.
Limitations
Author-stated: VTLoc performs relatively lower on uniform-surface objects due to inherent geometric ambiguity—multiple contact points may produce similar tactile readings. Adding normals degrades performance on the uniform subset because uniform objects' geometric information doesn't offer meaningful cues for tactile localization.
Analysis: The dataset has only 100 objects—improved over MidasTouch's 10 but still limited in scale. Tactile data uses a fixed ~1.0mm penetration depth; variations at different depths are unexplored. GMA's pseudo-point cloud uses a fixed $N^d$ points; the relationship to the input 1024 points and its impact on performance is not discussed. ILU uses a fixed iteration count $N$; an adaptive stopping mechanism could improve efficiency. All experiments use GelSight sensors; generalization to other tactile sensors (DIGIT, BioTac) is unverified.
Conclusion and Future Work
VTLoc's core contribution transforms cross-dimensional contact localization from relying on large-scale object-specific codebooks to an end-to-end framework learning directly from 2D tactile images and 3D point clouds. The GMA module enforces geometric consistency between tactile and visual modalities in 3D space through pseudo-point cloud reconstruction and Chamfer distance alignment—inspired by the human perceptual paradigm of "reconstruct the object mentally, then match the touched region." The ILU module uses GRU for iterative refinement, with exponentially increasing weights in the sequence loss emphasizing later iterations. The finding that normals help on non-uniform objects but hurt on uniform ones reveals the conditionality of geometric information usefulness in tactile localization. The 100-object real-world benchmark provides a standardized evaluation platform for the field.
The essence of tactile localization isn't memorizing each touch image, but understanding "which shape on the object does this feel correspond to"—geometric alignment lets machines reconstruct the object mentally before matching, just like humans.
SOURCE LINKS